Y axis or X axis Chart Gridlines to be bolded in Chart Report SSRS
While Creating a Report it was requirment like to bold out the zero Y axis line so that it will be look distinct then other lines below screenshot will give clear picture on this.

If you will click on the above screenshot all chart Gridliness are Grey in Color and the requirement was like to make Y axis 0 (middle line)to be bolded out so that it looks different from other lines.
So below are the step-
-Select your vertical axis ie y axis -Properties on Right side
or After selecting Vertical axis Press F4 key -Properties
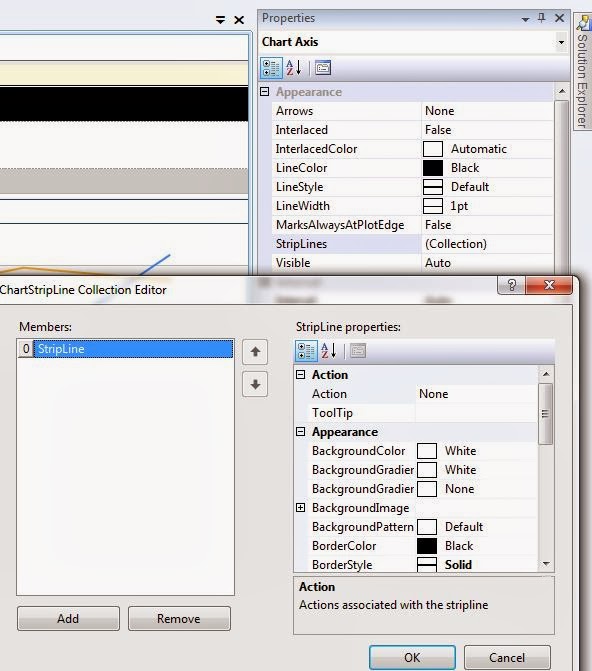
-Chart Axis Properties-In the Apperance Section-Stripline
-click on Stripline
-Add a new Stripline
-StripLine Properties
-Change Border color to black
Increase size of border to 1.5 so that it look different from other lines
-ok
Preview the Report
The chart will have the Y axis 0 line to bolded out in black color.

No comments:
Post a Comment